Sentiment Analysis Pipeline
Build a tabular operator to assess student course feedback, classifying sentiment and extracting recommendations.
In this tutorial, you’ll build a complete sentiment analysis pipeline that processes a spreadsheet of student course feedback. By the end, you’ll have a working workflow that classifies each response by topic and sentiment, extracts recommendations, and produces queryable results you can analyze with SQL.
What You’ll Build
- Upload an Excel spreadsheet of student course evaluations
- Create a tabular operator that processes each row independently
- Classify feedback along two dimensions: topic (course material vs. instructor vs. logistics) and sentiment
- Extract concrete recommendations from student responses
- Query the results with SQL
Download the sample dataset, an Excel file with ~200 rows of student feedback from a university data science course.
Prerequisites
You’ll need a Ragnerock account with an existing project. See Quick Start if you haven’t set one up yet.
Step 1: Upload the Dataset
Click the Upload button in the toolbar. Select the downloaded Excel file and click Upload.
Ragnerock recognizes spreadsheet structure automatically. Sheets become queryable units, and each row is available as an individual processing target for tabular operators.
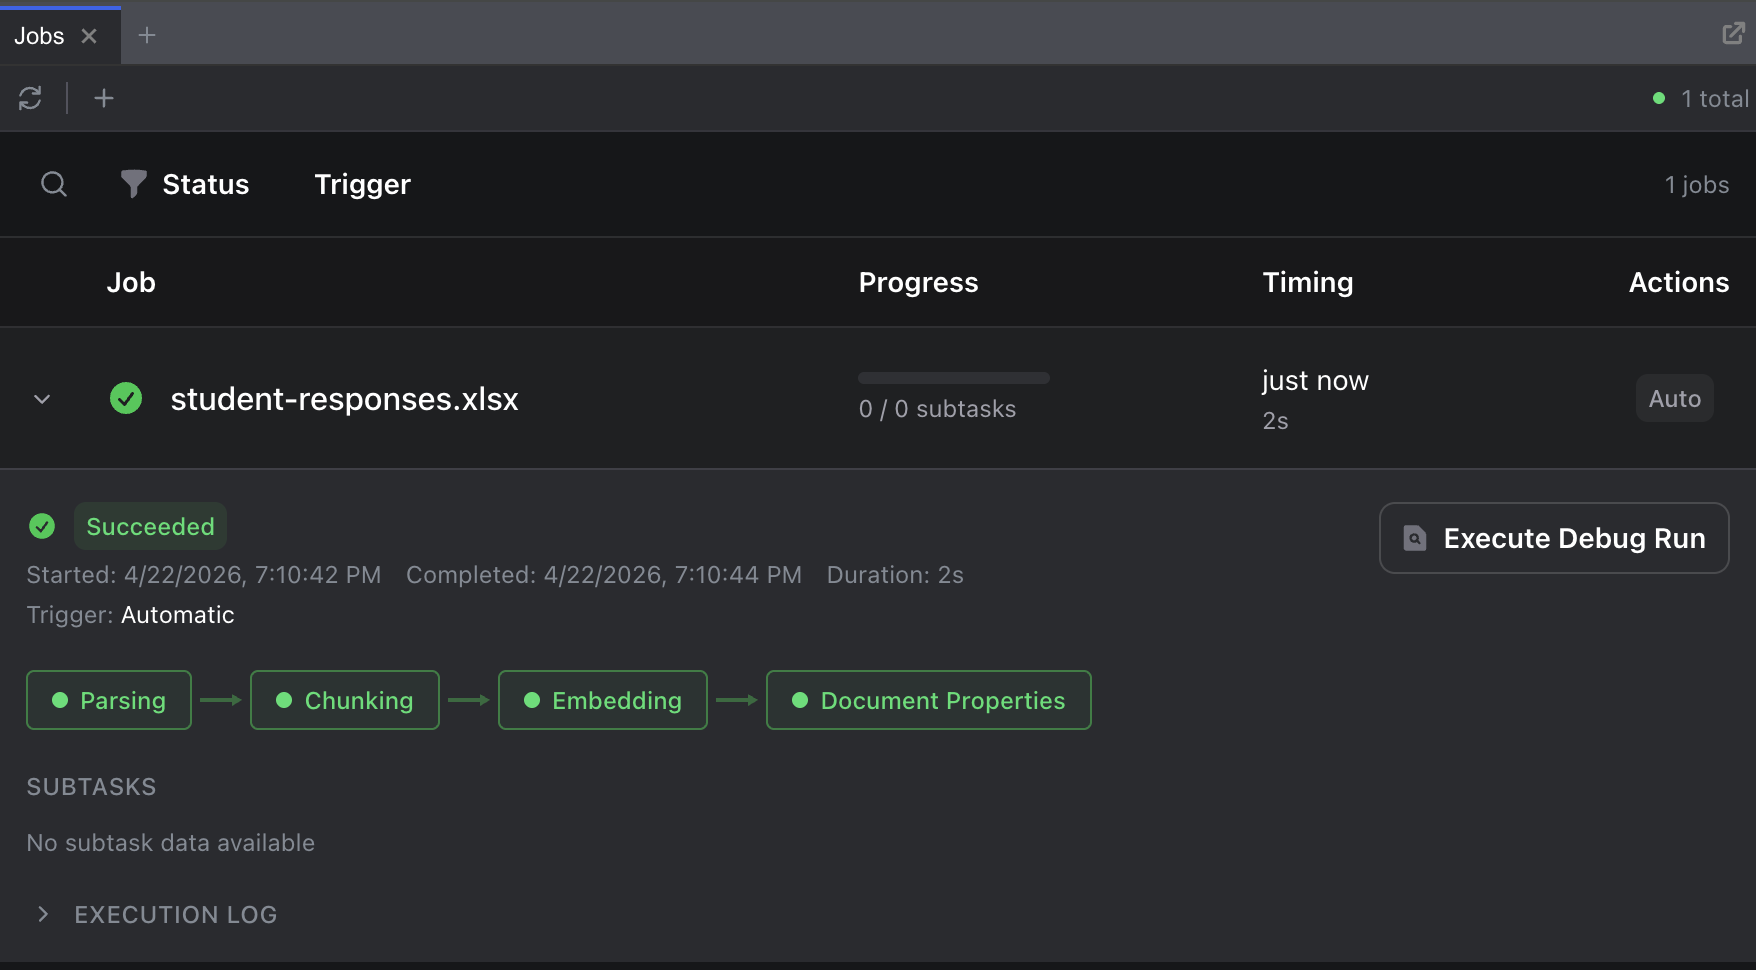
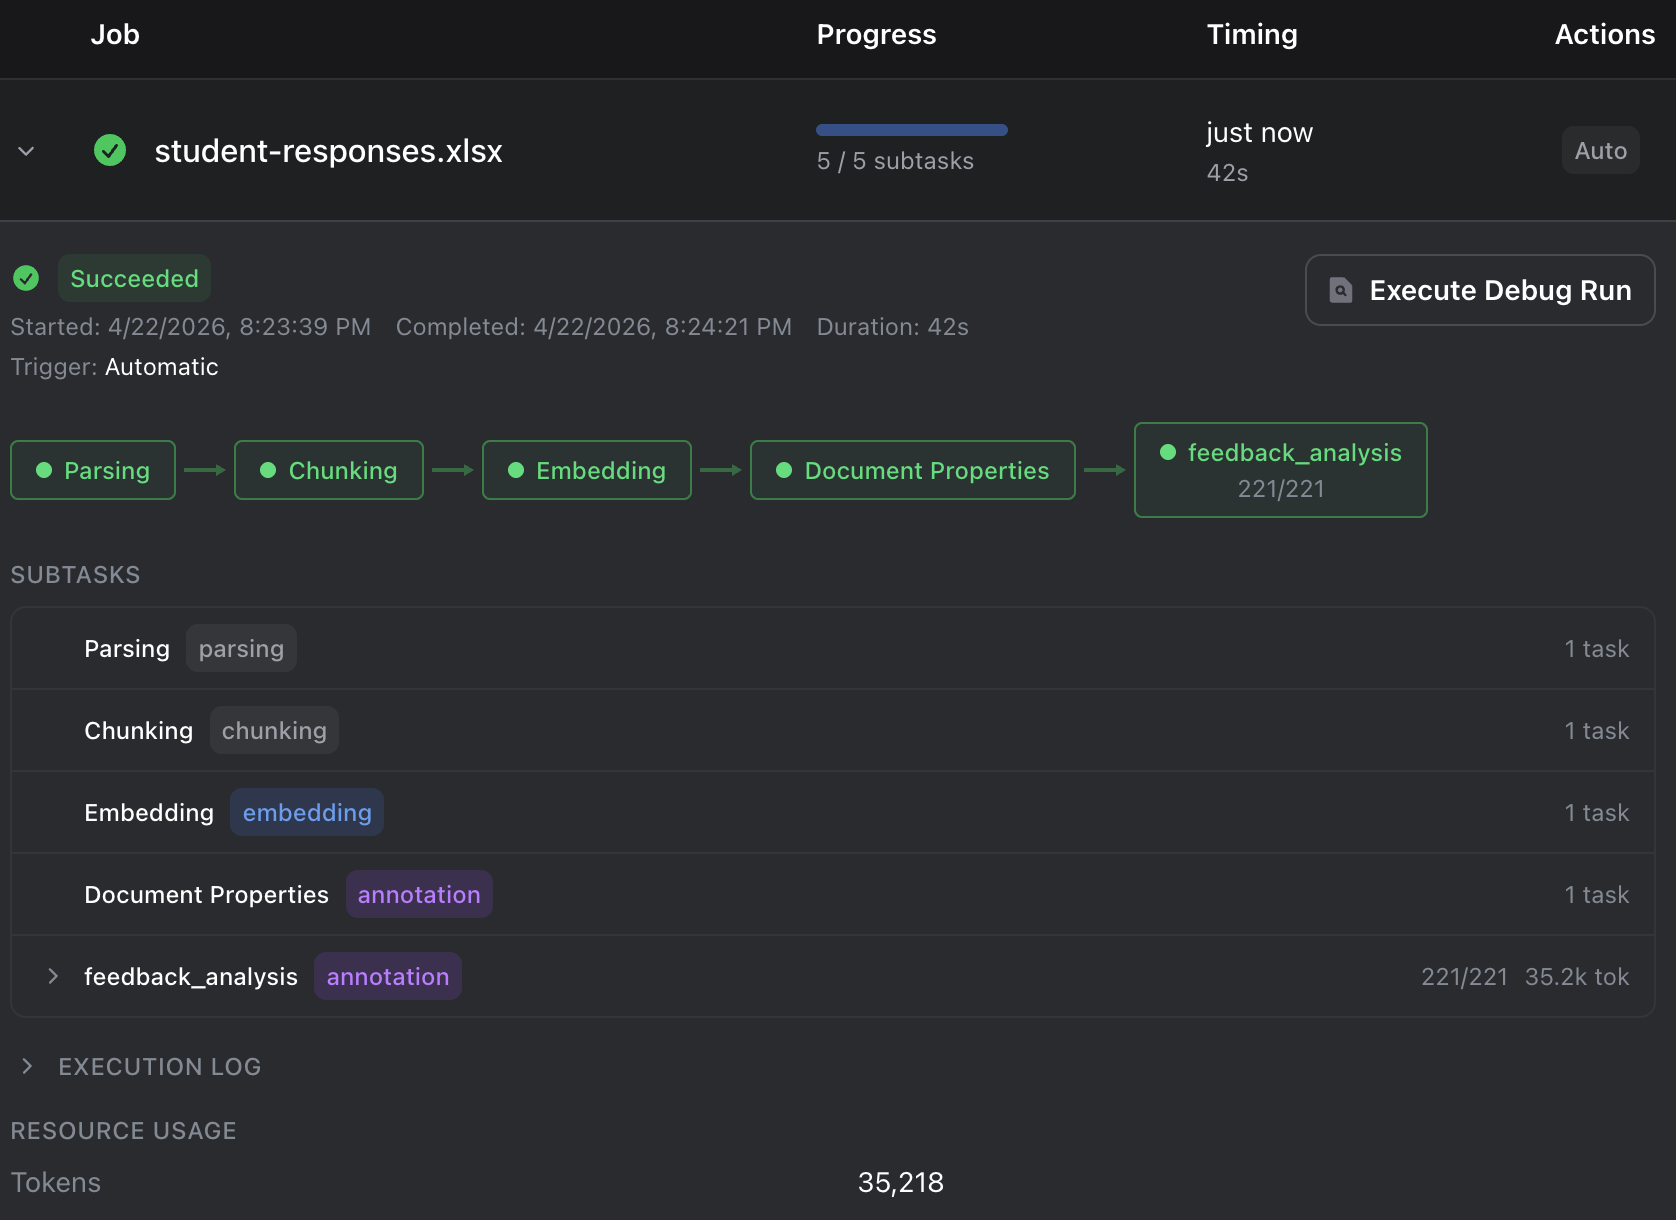
Open the Jobs dashboard from the sidebar to monitor processing. Once the status shows Succeeded, your spreadsheet is ready.
Step 2: Create the Feedback Operator
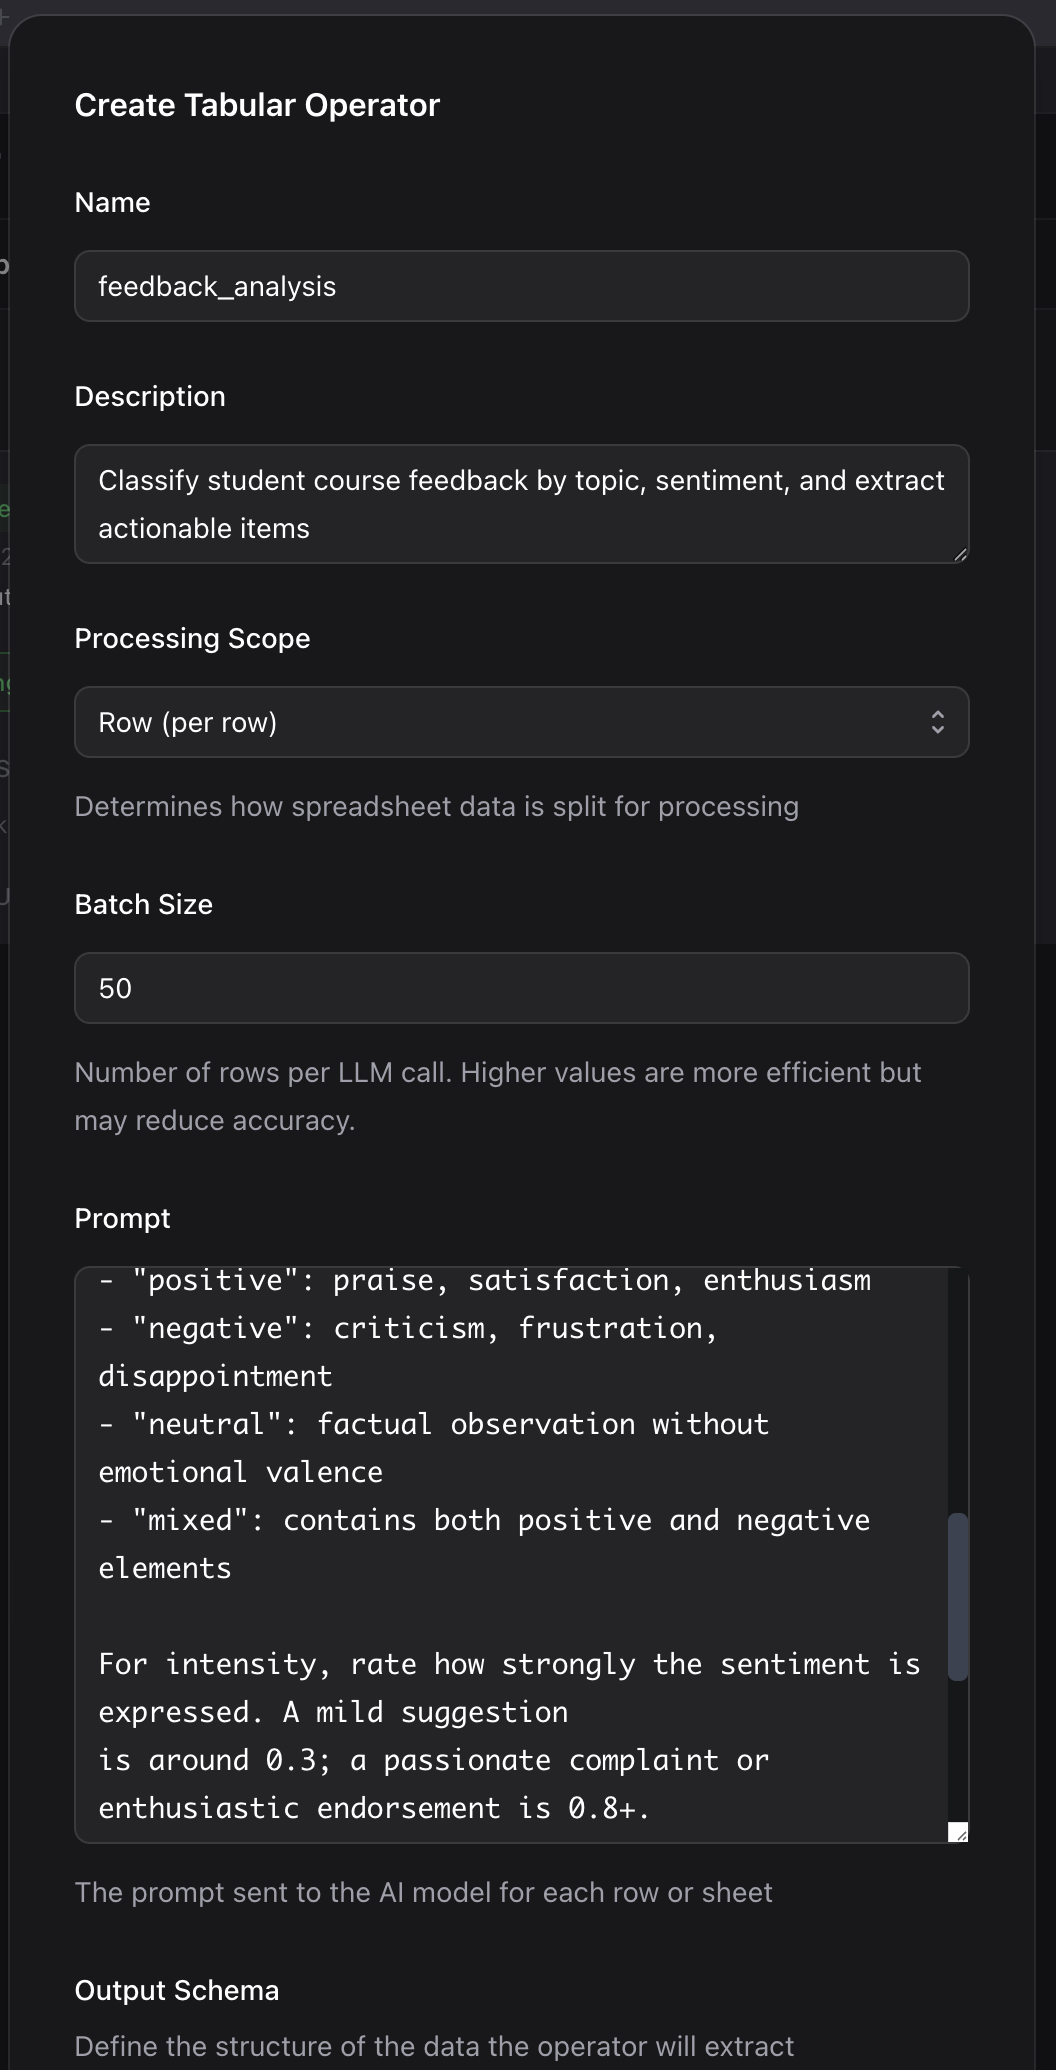
Navigate to the Workflows section in the sidebar, click Operators, then New Tabular Operator.
Configure Basic Settings
- Name:
feedback_analysis - Description: “Classify student course feedback by topic, sentiment, and extract recommendations”
- Scope: Select Row from the dropdown. This tells Ragnerock to process each spreadsheet row independently.
Define the Schema
In the schema builder, add the following fields:
| Field | Type | Constraints | Description |
|---|---|---|---|
topic | enum | required; values: “course_material”, “instructor”, “logistics”, “assessment”, “other” | The primary topic of the student’s feedback |
sentiment | enum | required; values: “positive”, “negative”, “neutral”, “mixed” | Overall sentiment toward the identified topic |
recommendation | string | optional | A concrete recommendation if the student proposes one |
Using enums for topic and sentiment ensures consistent categories you can filter and group by in queries.
Write the Generation Prompt
In the Generation Prompt field, enter:
Analyze this student course evaluation response.

For topic, classify what the student is primarily commenting on:
- "course_material": feedback about lectures, readings, assignments, or course content
- "instructor": feedback about teaching style, communication, availability, or rapport
- "logistics": feedback about scheduling, room, technology, or course administration
- "assessment": feedback about exams, grading, or evaluation methods
- "other": feedback that doesn't fit the above categories

For sentiment, assess the student's tone toward the identified topic:
- "positive": praise, satisfaction, enthusiasm
- "negative": criticism, frustration, disappointment
- "neutral": factual observation without emotional valence
- "mixed": contains both positive and negative elements

For recommendation, extract a concrete suggestion only if the student
explicitly proposes a change (e.g., "more group projects", "office hours on
Fridays"). If no recommendation is present, omit this field.
Click Save to create the operator.
Step 3: Build and Run the Workflow
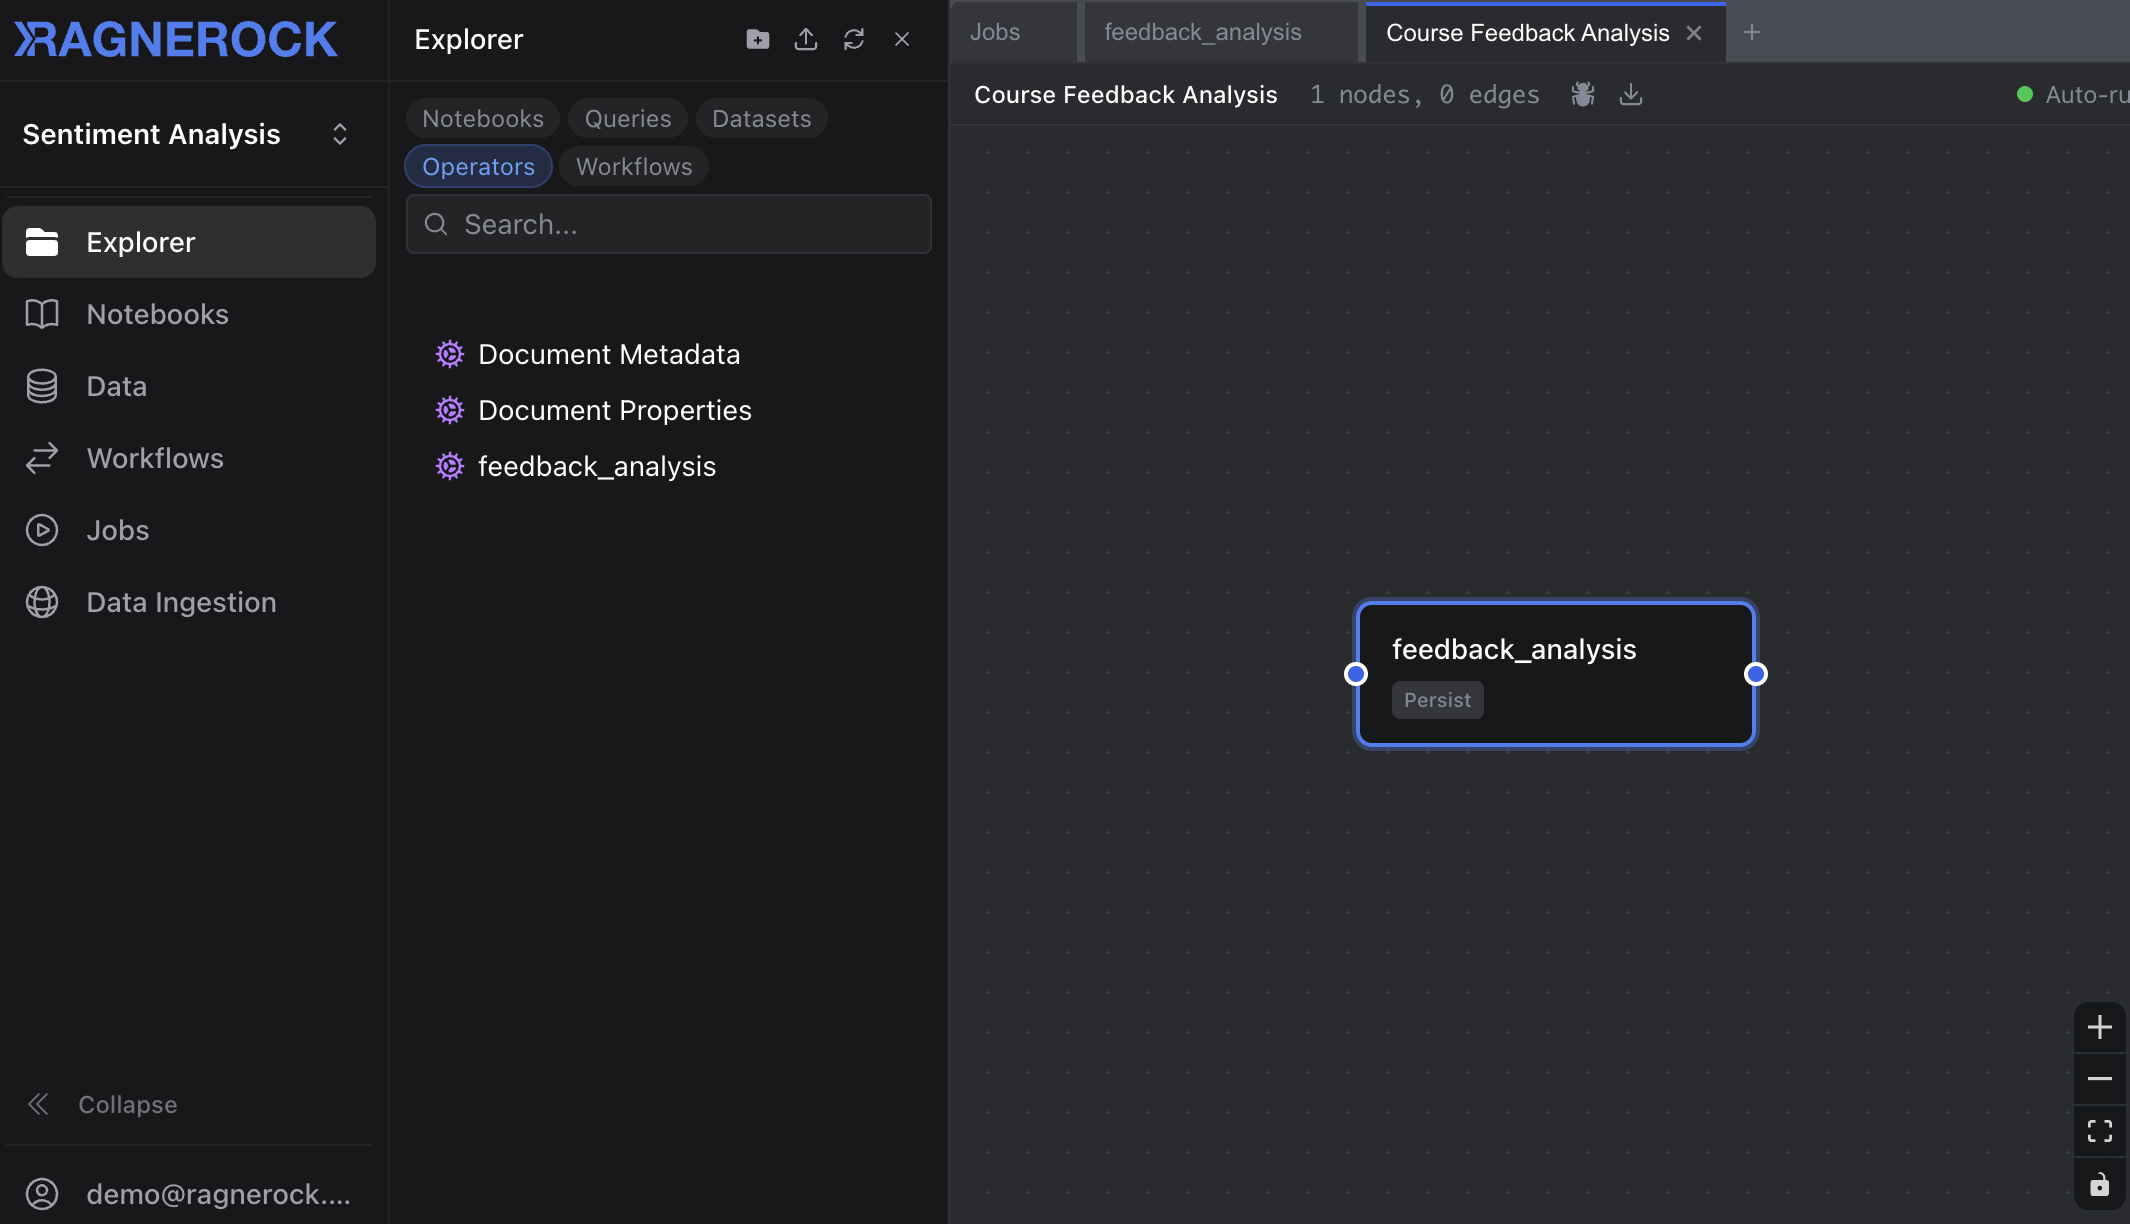
- Navigate to Workflows in the sidebar and click New Workflow
- Name it “Course Feedback Analysis”
- Drag the
feedback_analysisoperator from the operator explorer on the left into the workflow canvas - Click Save
- Open the Jobs panel from the sidebar and click the + button in the upper left to start a new job
- Select the uploaded Excel file and click Run Workflow
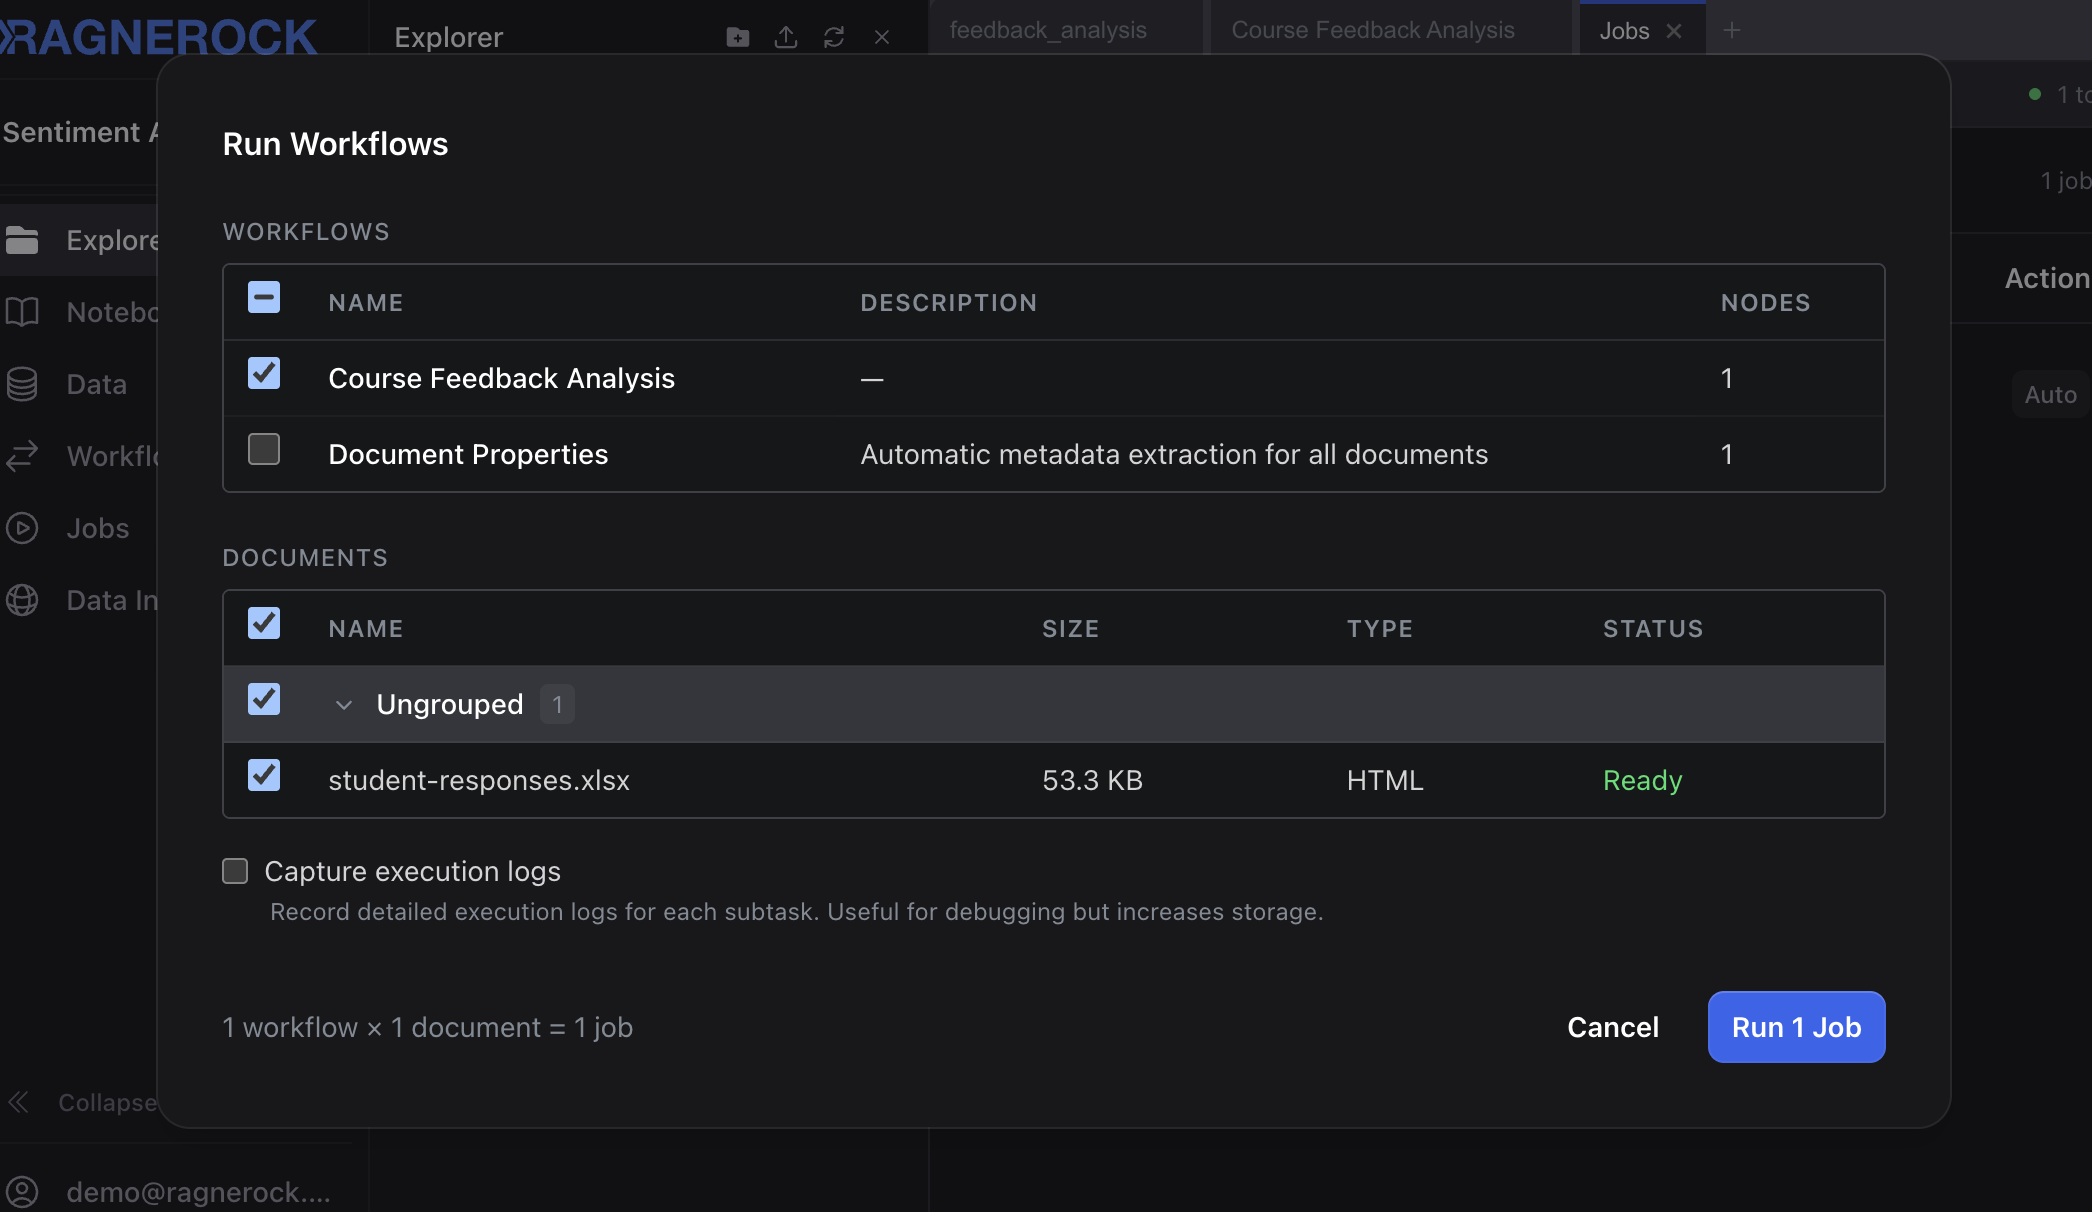
Monitor progress in the Jobs dashboard. Since each row processes independently, you’ll see the job progress through all rows. When the job shows Succeeded, your annotations are ready.
Step 4: Query Results
Open the Query Explorer from the sidebar. The operator name (feedback_analysis) is your table name.
Sentiment Distribution by Topic
SELECT
    topic,
    sentiment,
    count(*) as N
FROM feedback_analysis
GROUP BY topic, sentiment
ORDER BY N DESC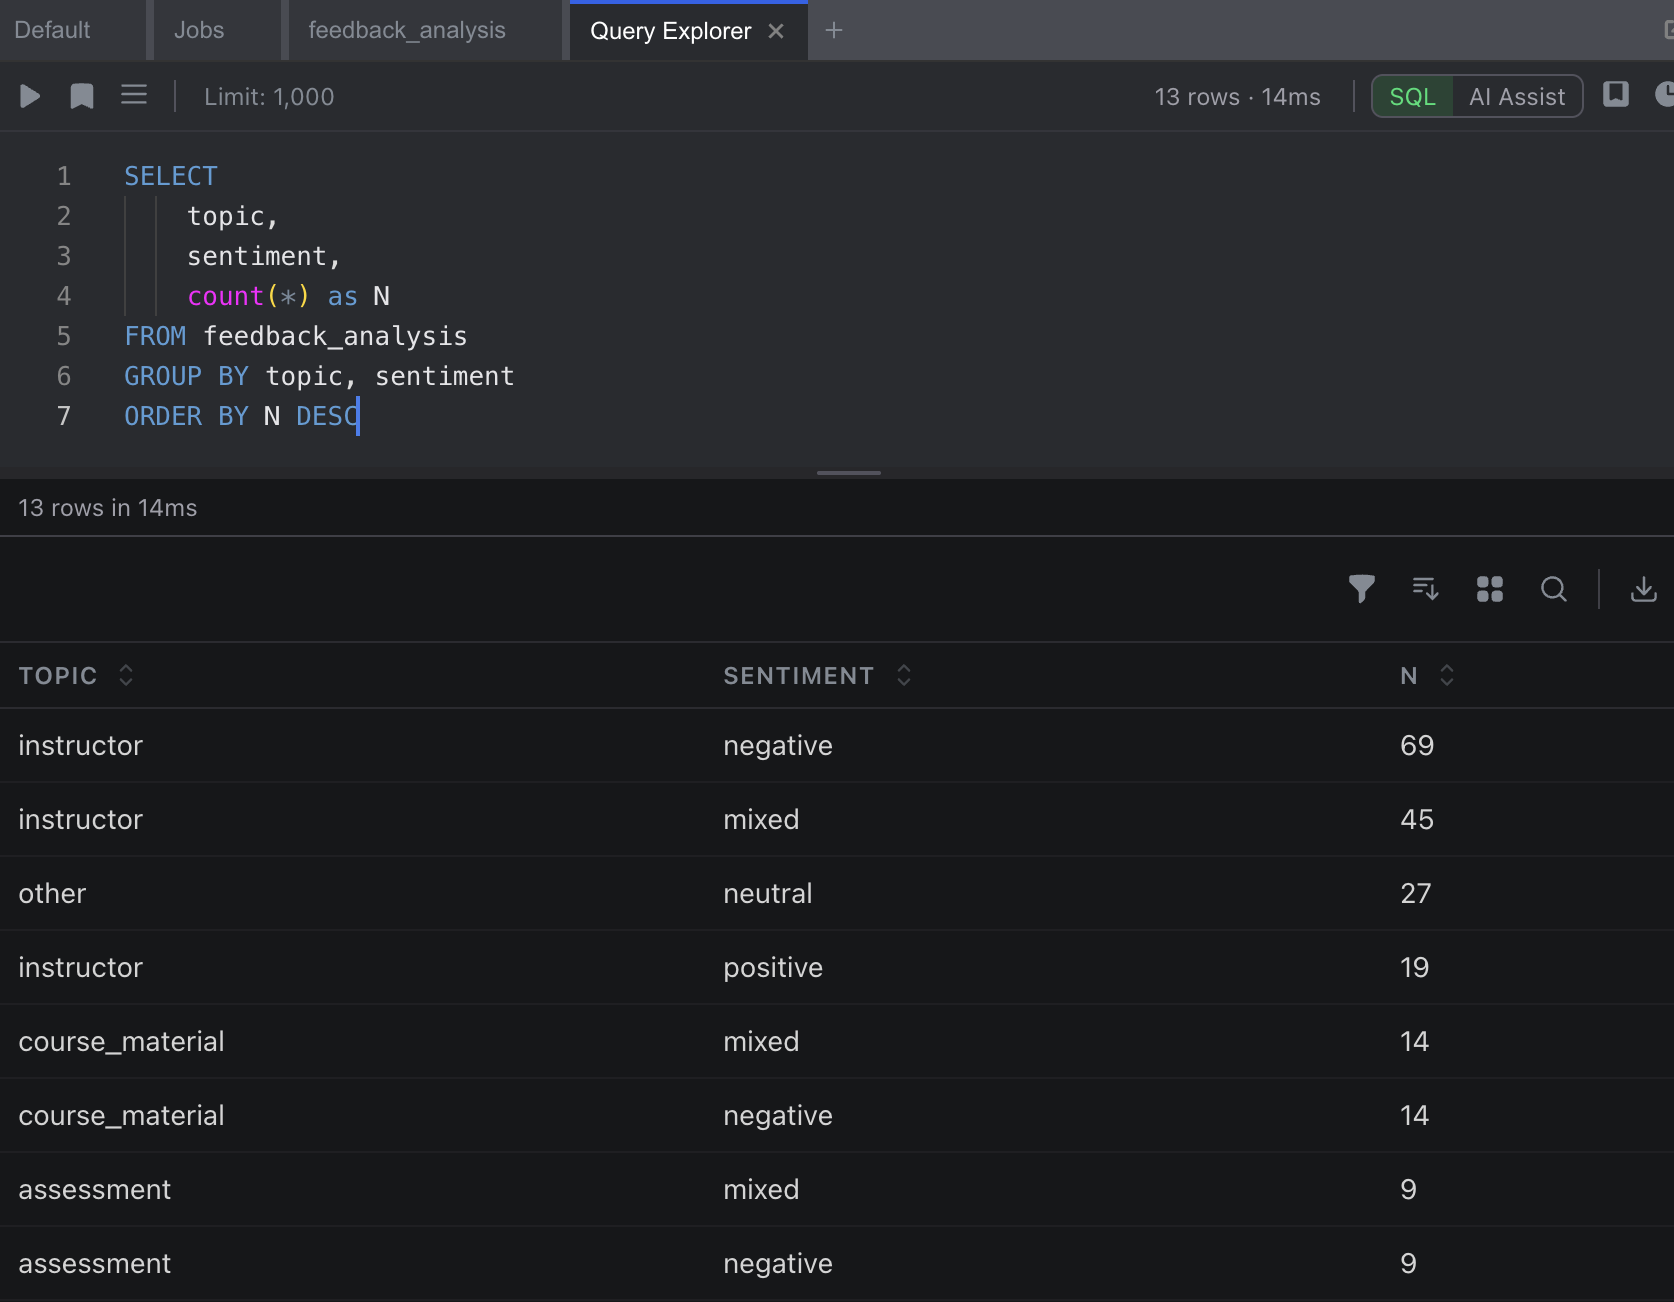
Negative Feedback Recommendations
SELECT
    topic,
    recommendation
FROM feedback_analysis
WHERE sentiment = 'negative'
AND recommendation IS NOT NULL
Cross-Tabulation: Topic by Sentiment
SELECT
    topic,
    COUNT(CASE WHEN sentiment = 'positive' THEN 1 END) as positive,
    COUNT(CASE WHEN sentiment = 'negative' THEN 1 END) as negative,
    COUNT(CASE WHEN sentiment = 'neutral' THEN 1 END) as neutral,
    COUNT(CASE WHEN sentiment = 'mixed' THEN 1 END) as mixed
FROM feedback_analysis
GROUP BY topic
ORDER BY negative DESC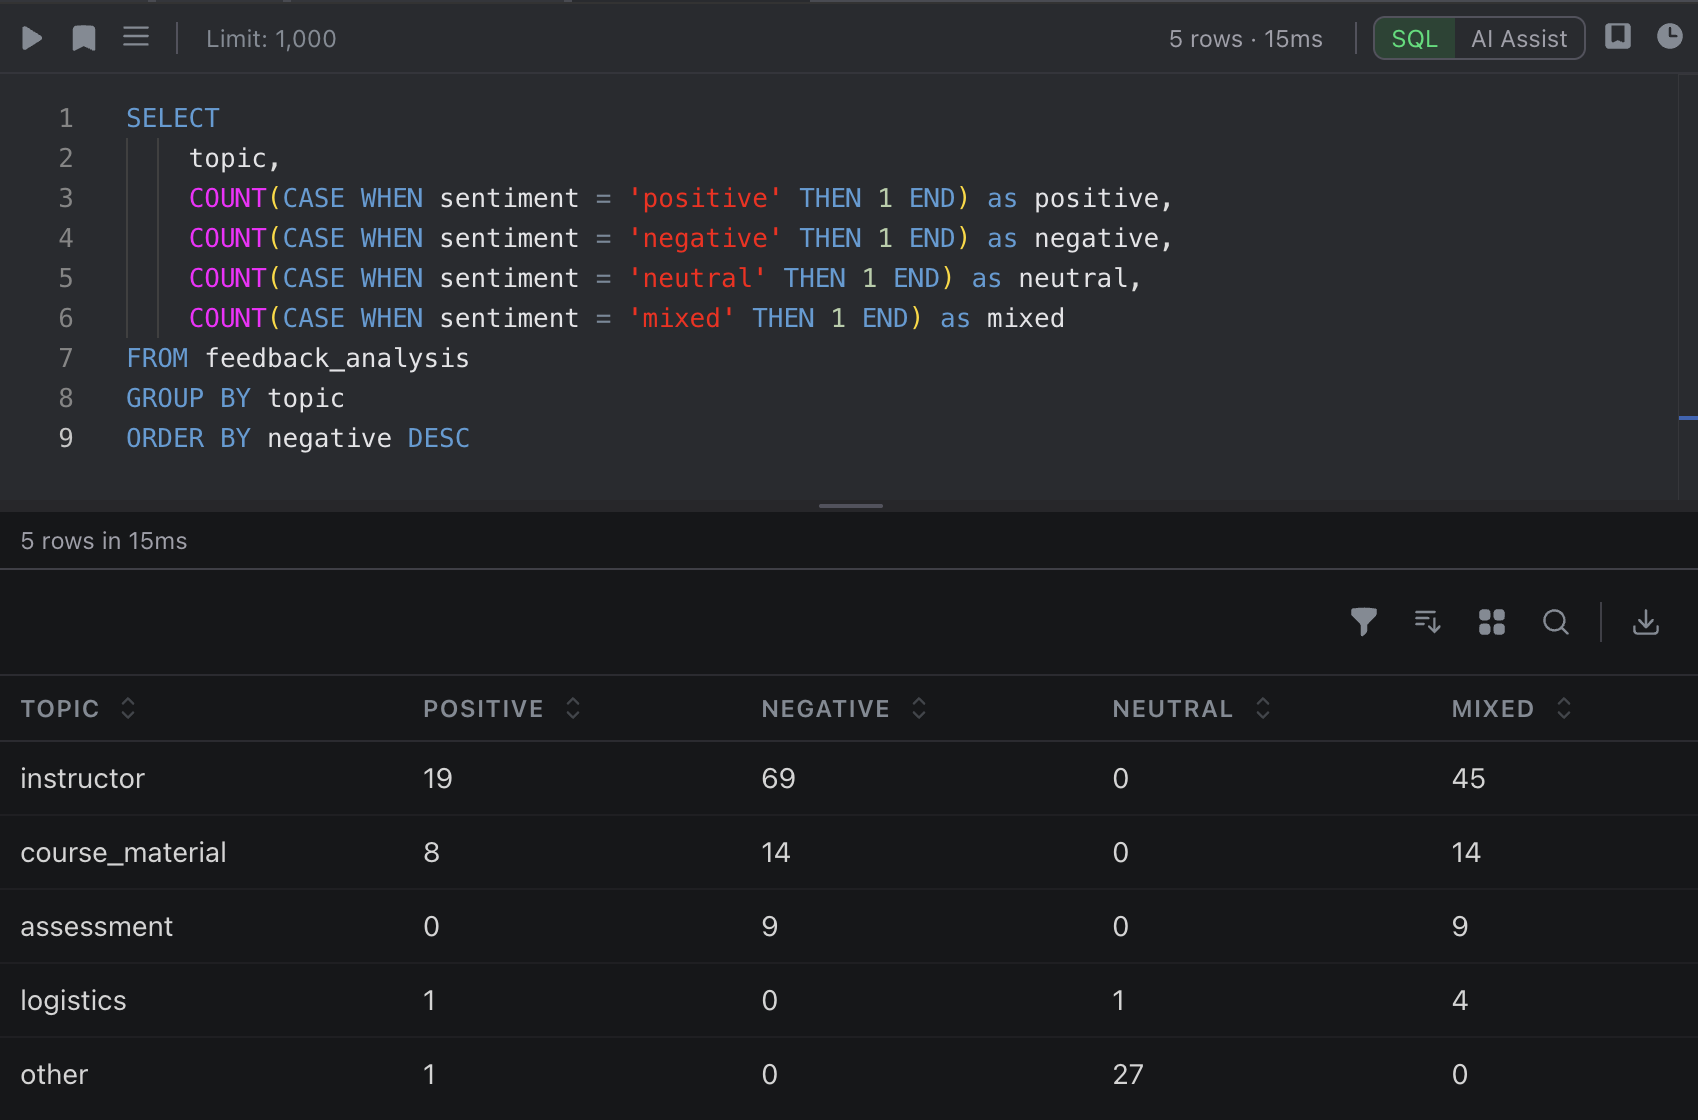
Step 5: Explore Results in a Notebook
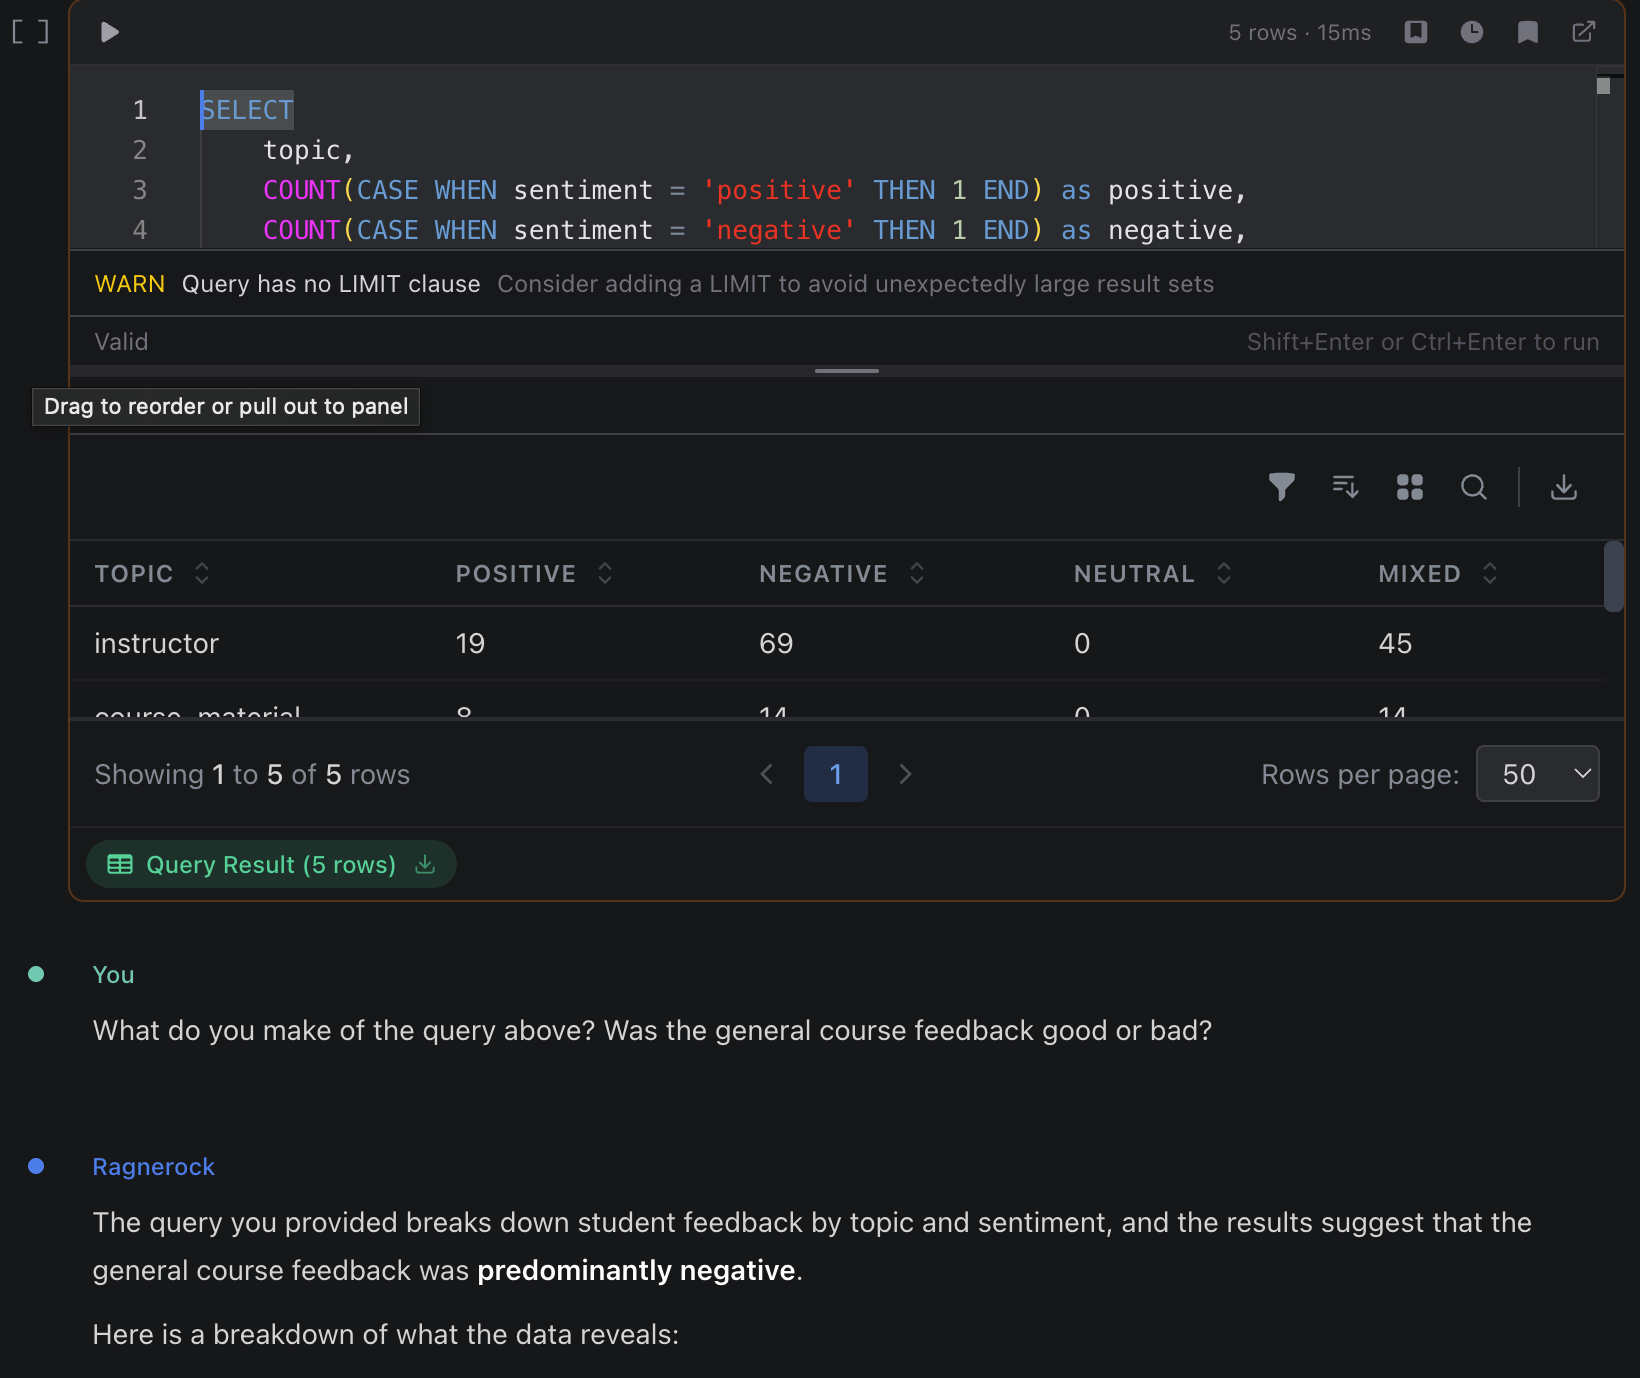
You can also run queries inside a notebook and then discuss the results with the Research Agent. To do this, create a new cell and set its type to Query. Run your query, then add a Chat cell below it and ask the agent a follow-up question about the results. Alternatively, if you have both the Query Explorer and a notebook open, you can drag and drop a query directly from the Query Explorer into the notebook.
Next Steps
- JupyterLab Integration: Connect a notebook to a JupyterLab kernel for Python analysis and visualization of your query results
- Advanced Query Patterns: More SQL recipes for analysis
- Operators: Deep dive into operator configuration and prompt design
- Workflows: Workflow orchestration and auto-run triggers