Quick Start
Upload your first document and start exploring in minutes.
This guide walks you through the core Ragnerock workflow: uploading data, exploring it with the Research Agent, and then operationalizing your analysis with workflows.
1. Sign In
Navigate to your Ragnerock instance and sign in. A default project is created automatically when you first sign up, and you’ll land in it immediately.
Projects are logical containers for related data, workflows, and notebooks. You can create additional projects from the Projects settings screen if you need to isolate different workstreams.
2. Upload a Document
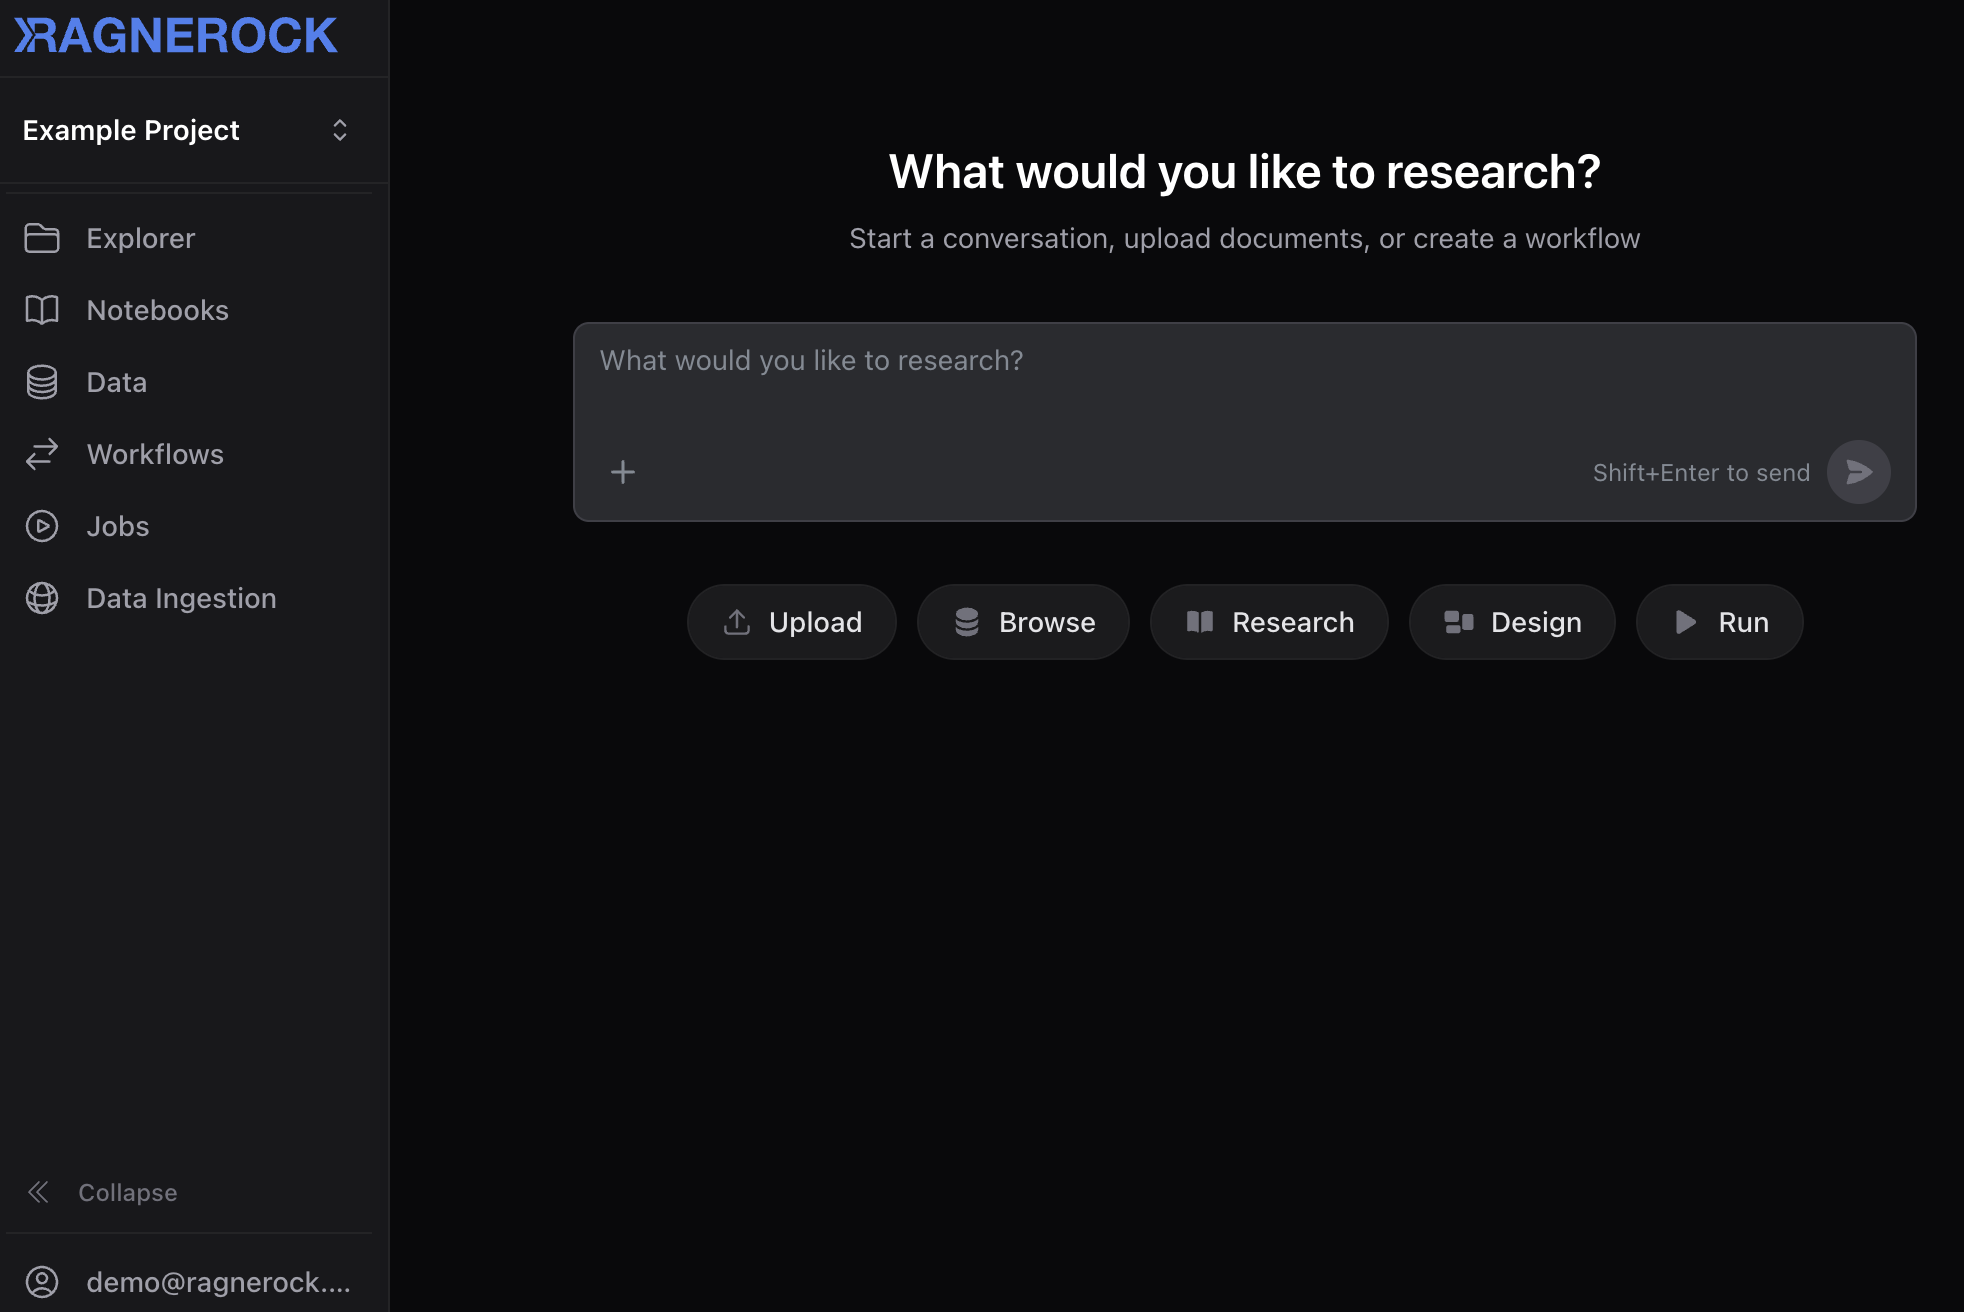
Click the Upload quick action on the welcome screen, or click the Data section in the sidebar and select Upload.
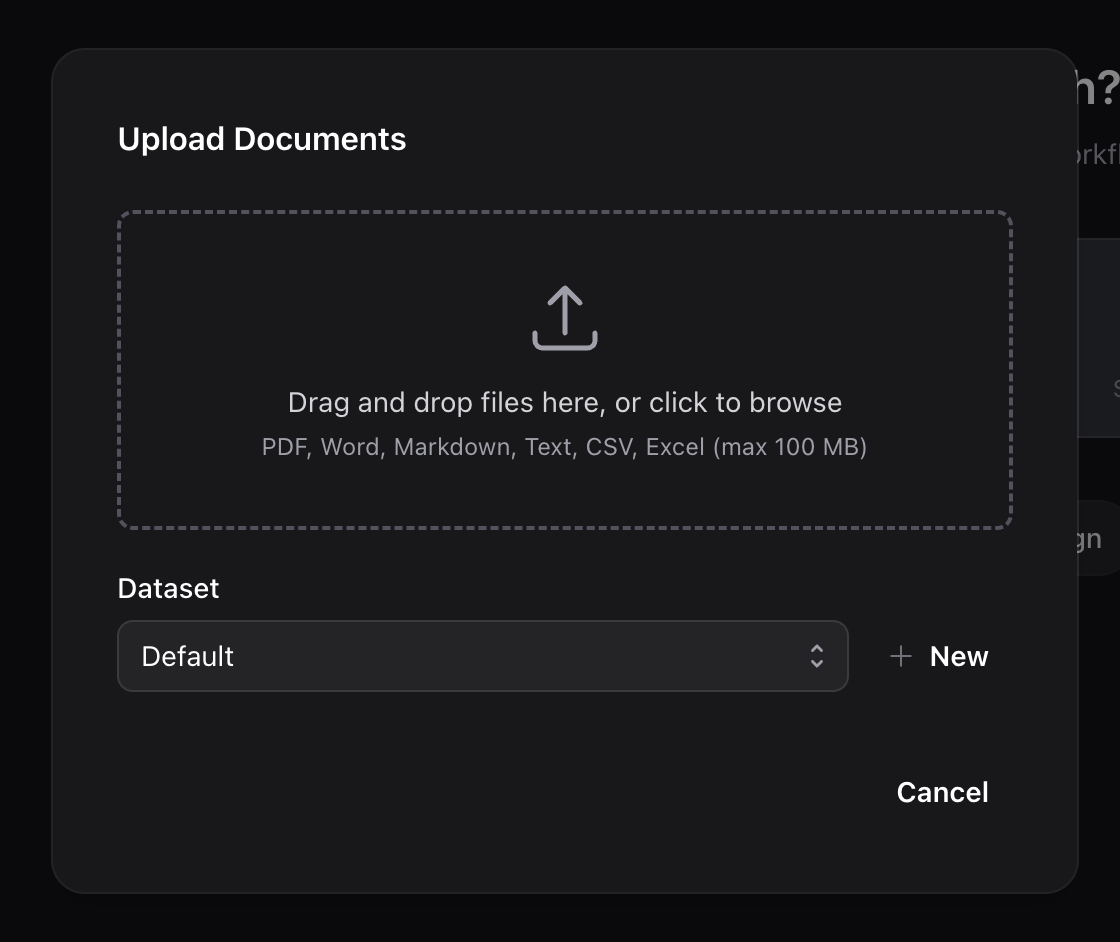
In the upload dialog:
- Drag and drop a file into the upload area, or click to browse your file system
- Optionally assign the document to a dataset for organization
- Click Upload
Ragnerock automatically processes the document, extracting text, generating searchable chunks, and creating vector embeddings. You can upload multiple files at once.
Wait for your document to reach Ready status in the document list (green checkmark). For detailed processing information, check the Jobs dashboard in the sidebar.
3. Open a Notebook
Navigate to the Notebooks section in the sidebar and click New. Give it a name and you’ll land in an empty notebook with a message input ready.
Attach Your Document
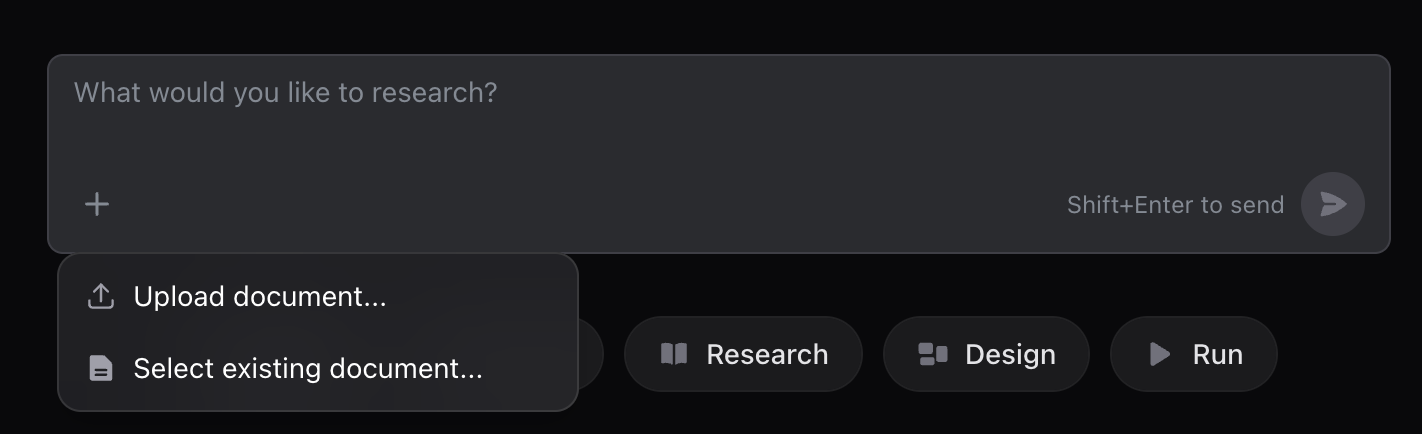
Click the Attach documents button (paper clip icon) in the message input and select the document you just uploaded. This tells the Research Agent to focus on that specific document.
Ask a Question
Type a question and press Enter:
“Summarize the key points in this document.”
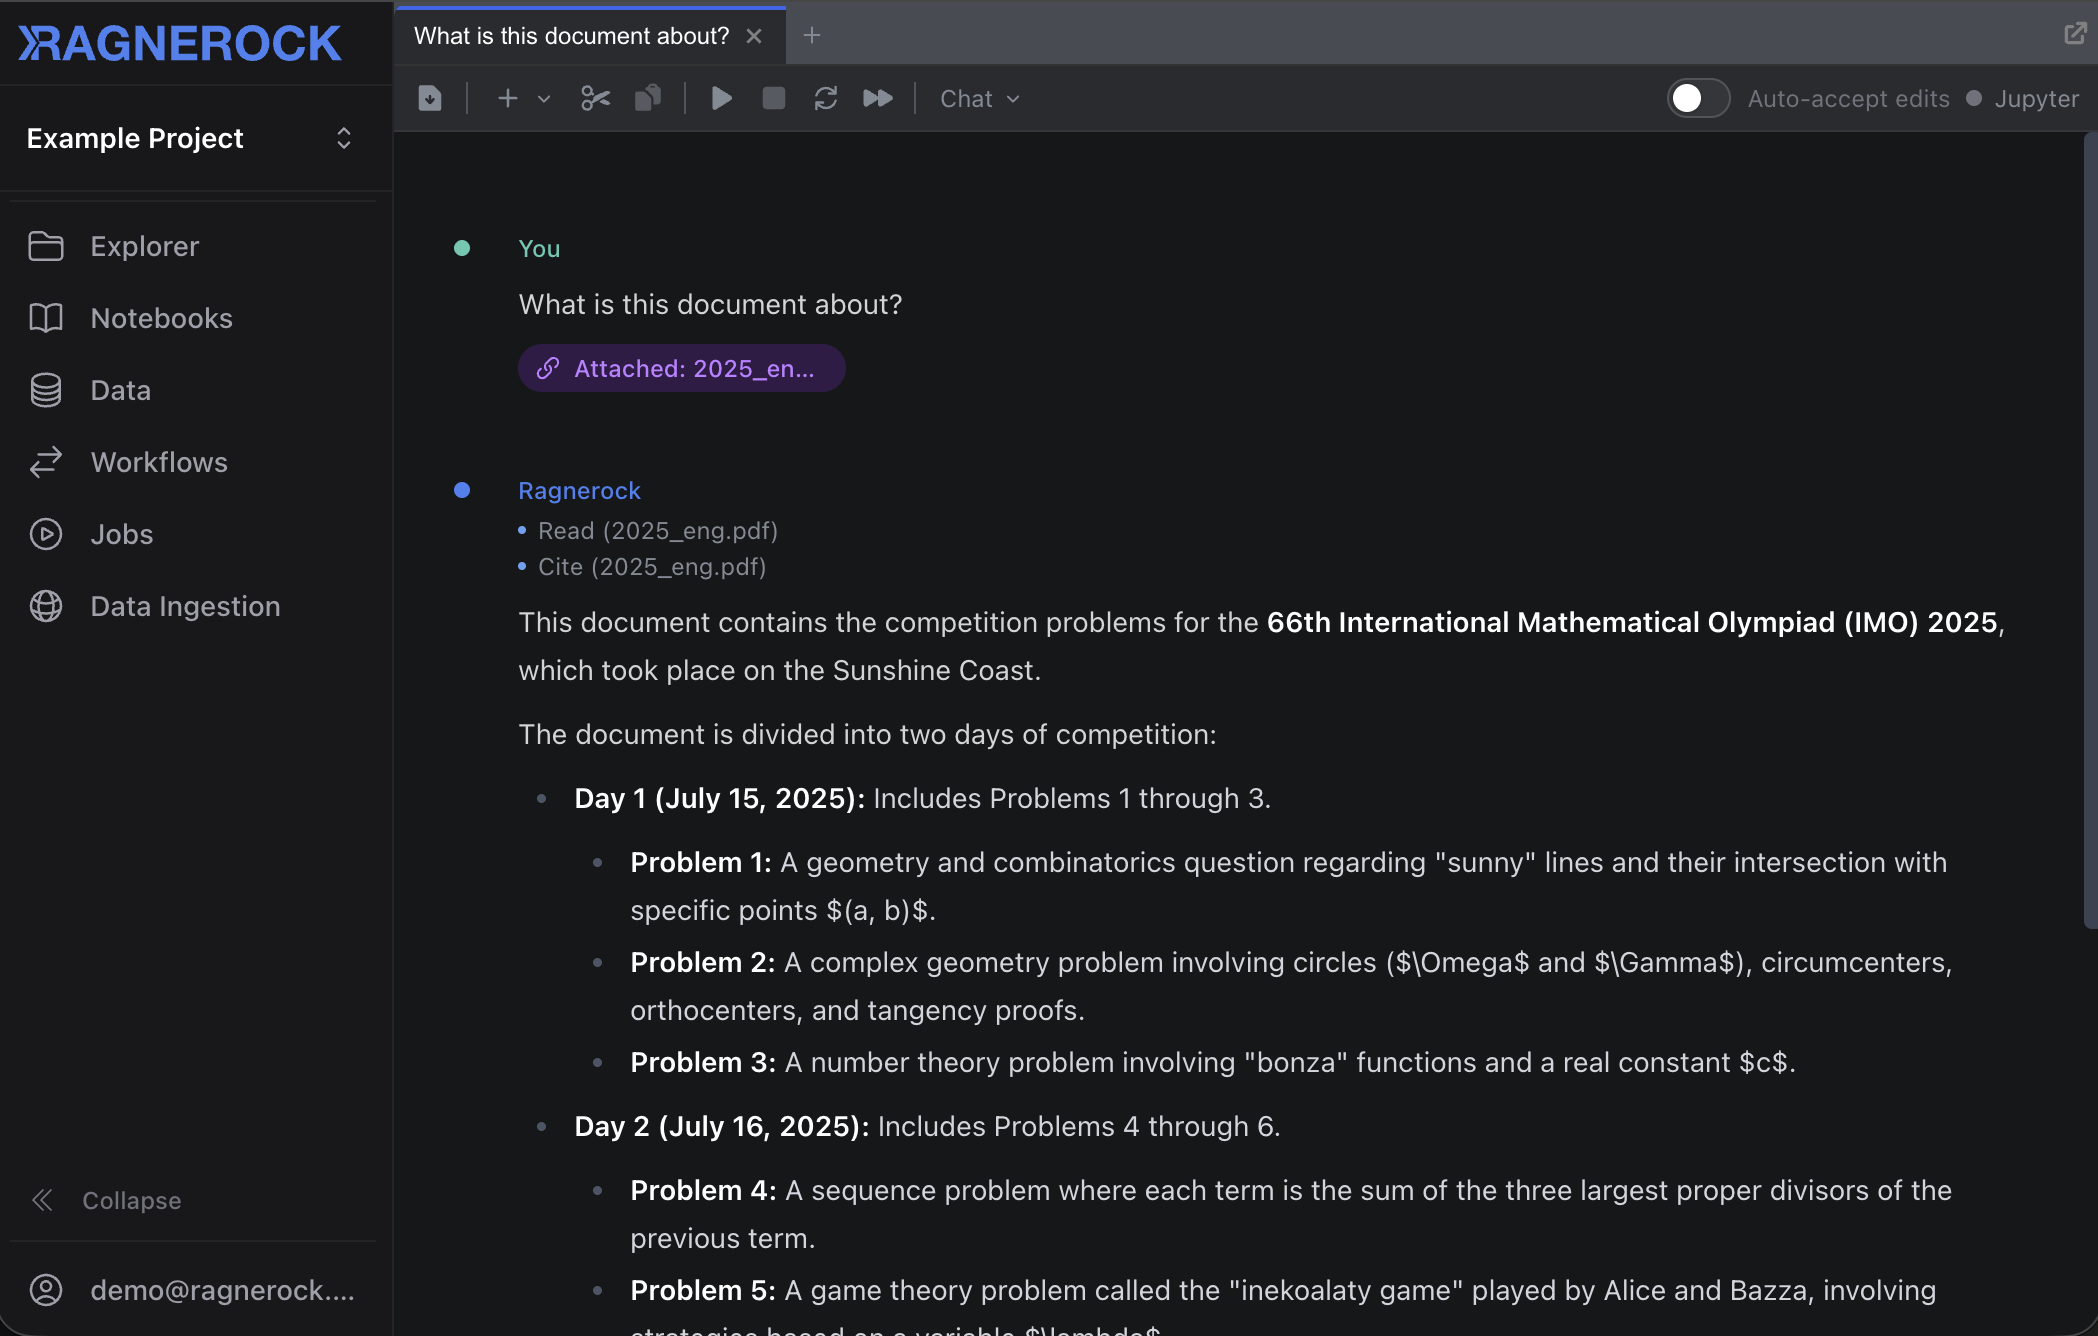
The Research Agent searches the document, synthesizes an answer, and streams its response with citations that link back to the exact source passages. Click any citation to verify.
4. Explore Interactively
Continue the conversation with follow-up questions:
“What risk factors are mentioned?”
“Create a table of all financial metrics discussed.”
When the agent produces tabular data, the response includes a DataFrame artifact, a structured table you can browse directly in the notebook. If you’ve connected your notebook to a JupyterLab kernel, you can import the artifact into your Python environment by clicking the artifact badge and selecting Import:
import pandas as pd

df = pd.DataFrame(financial_metrics)  # imported from the agent
print(df.describe())
This workflow (ask questions, get structured data, analyze programmatically) is the core notebook loop.
5. Create an Operator
Once you’ve explored your data and identified a repeatable analysis (e.g., “extract sentiment for every paragraph”), operationalize it with an operator.
Navigate to the Workflows section in the sidebar, click Operators, then New Operator.
Fill in the form:
- Name: e.g., “Sentiment Analysis”
- Description: What this operator produces
- Scope: Choose the granularity: Document, Page, Paragraph, or Sentence
- Generation Prompt: Instructions for the AI model
- JSON Schema: Define the output table structure
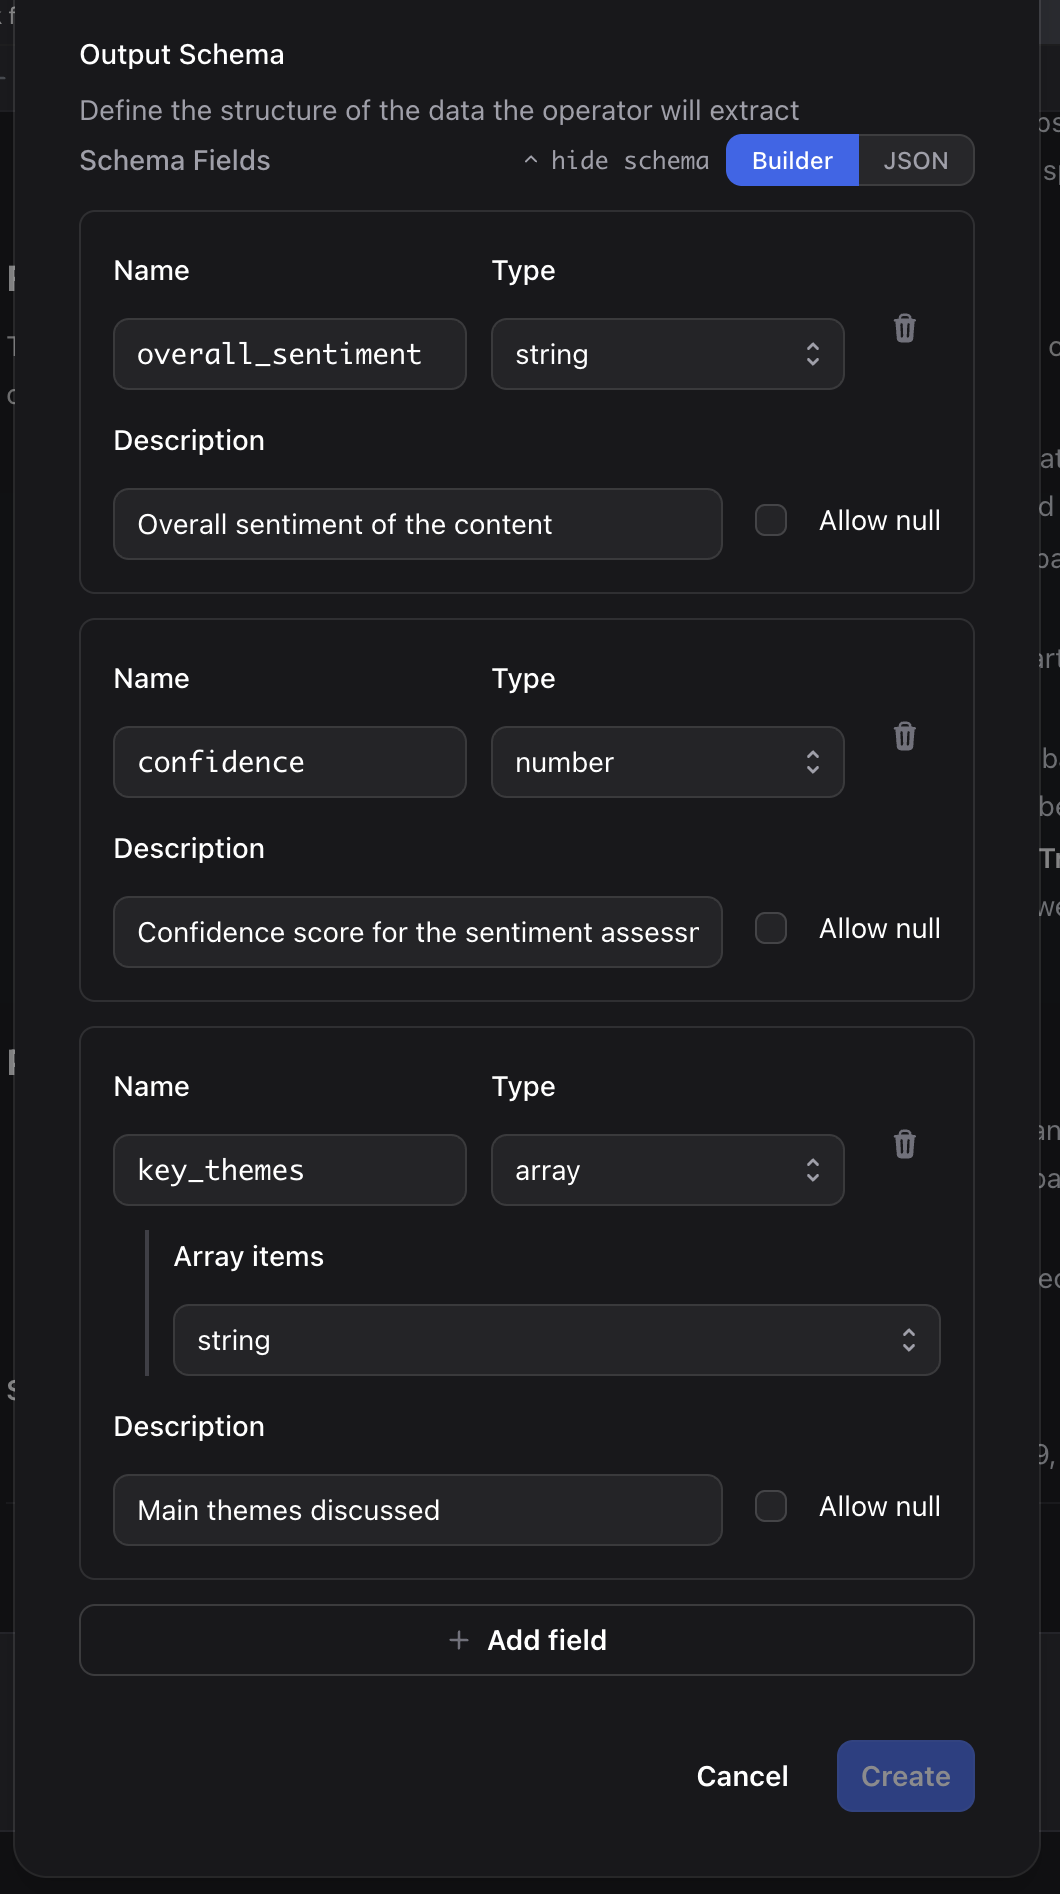
Example schema:
{
  "type": "object",
  "properties": {
    "overall_sentiment": {
      "type": "string",
      "enum": ["very_negative", "negative", "neutral", "positive", "very_positive"],
      "description": "Overall sentiment of the content"
    },
    "confidence": {
      "type": "number",
      "minimum": 0,
      "maximum": 1,
      "description": "Confidence score for the sentiment assessment"
    },
    "key_themes": {
      "type": "array",
      "items": {"type": "string"},
      "maxItems": 5,
      "description": "Main themes discussed"
    }
  },
  "required": ["overall_sentiment", "confidence", "key_themes"]
}
6. Build & Run a Workflow
Navigate to Workflows in the sidebar and click New Workflow.
- Give your workflow a name
- Drag your operator from the palette onto the canvas
- Click Save, then click Run
- Select the documents to process and click Run Workflow
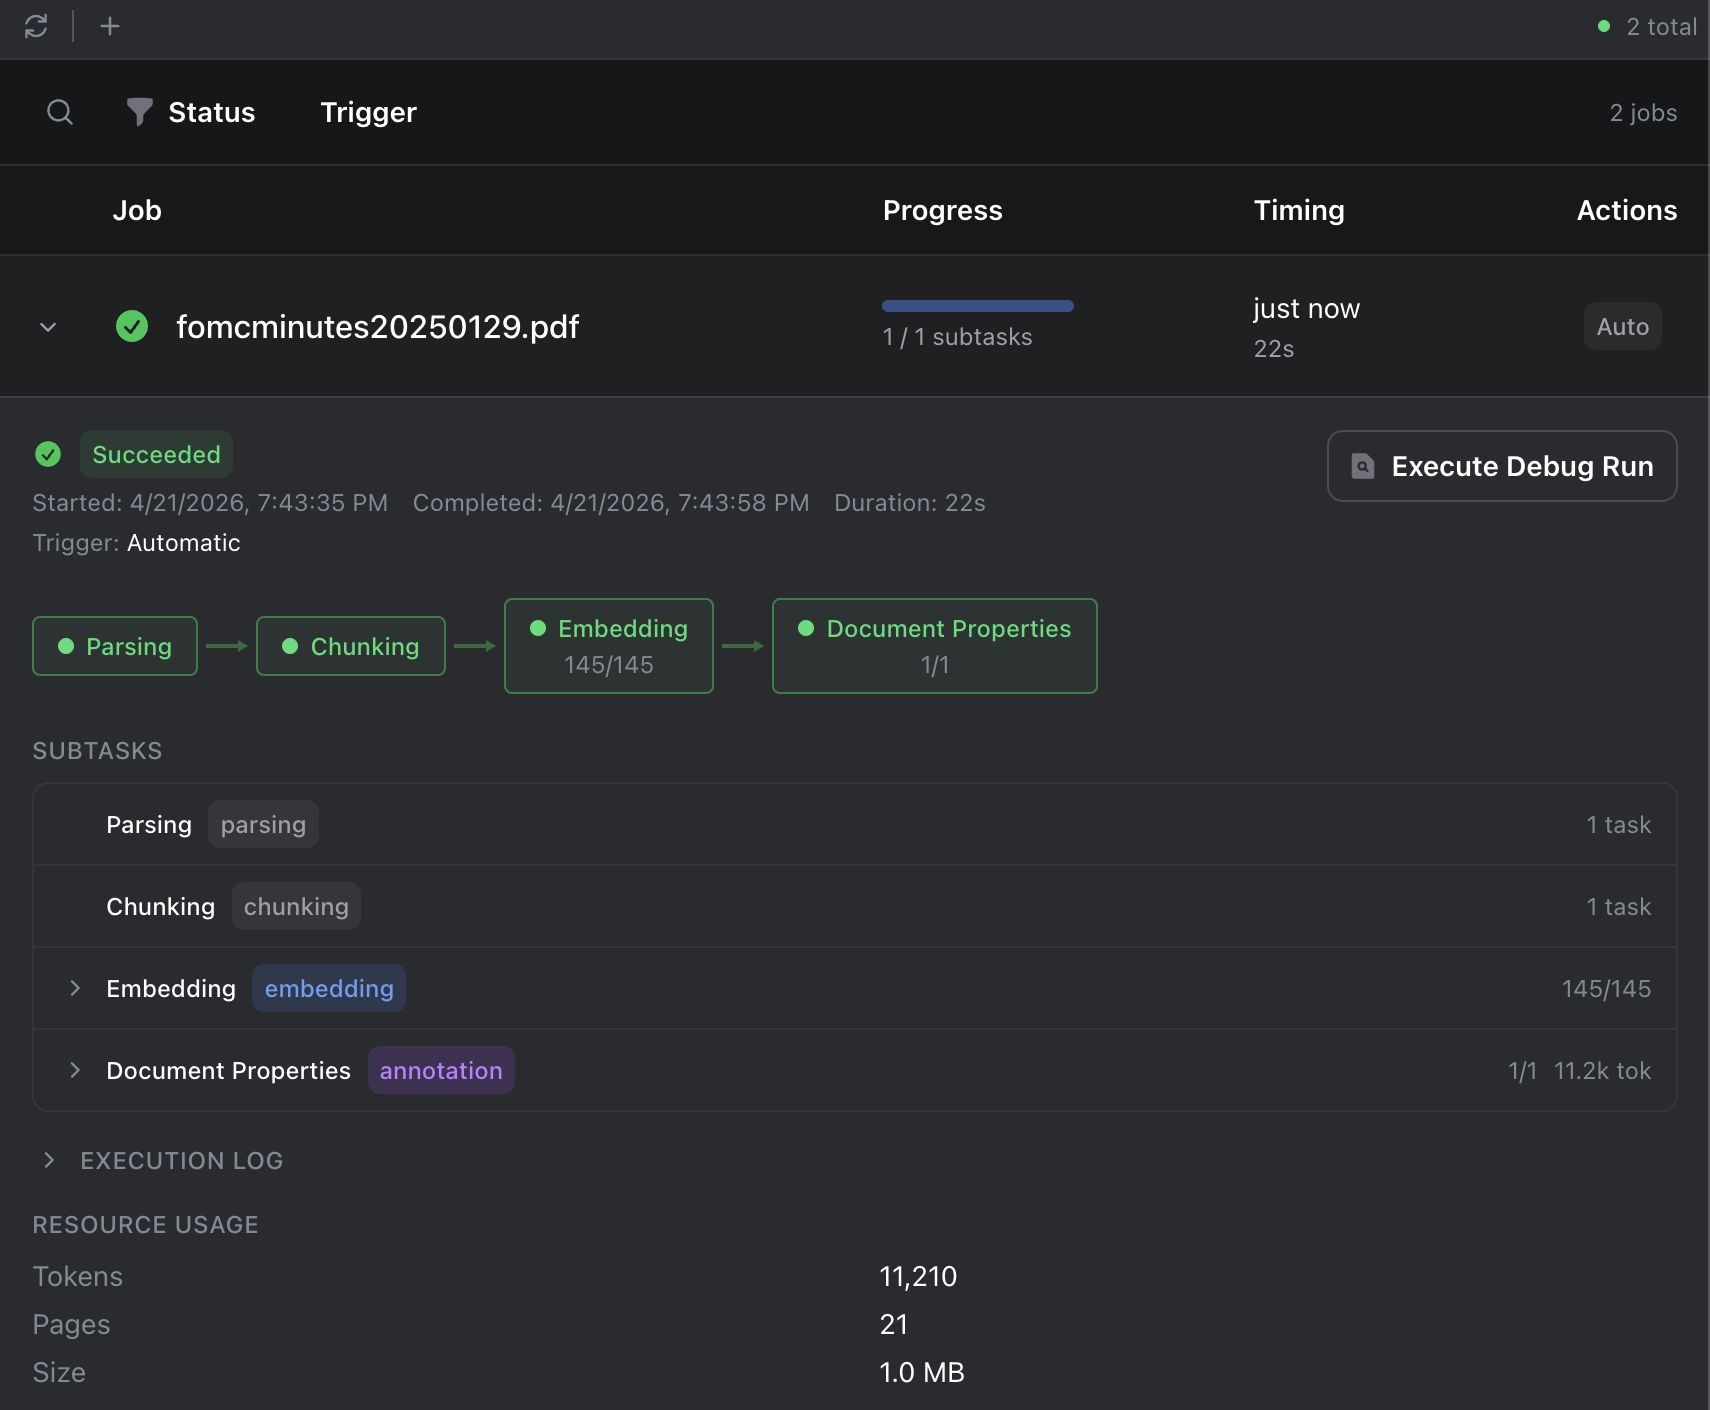
Monitor progress in the Jobs dashboard. When the job shows Succeeded, your data is ready to query.
7. Query Results with SQL
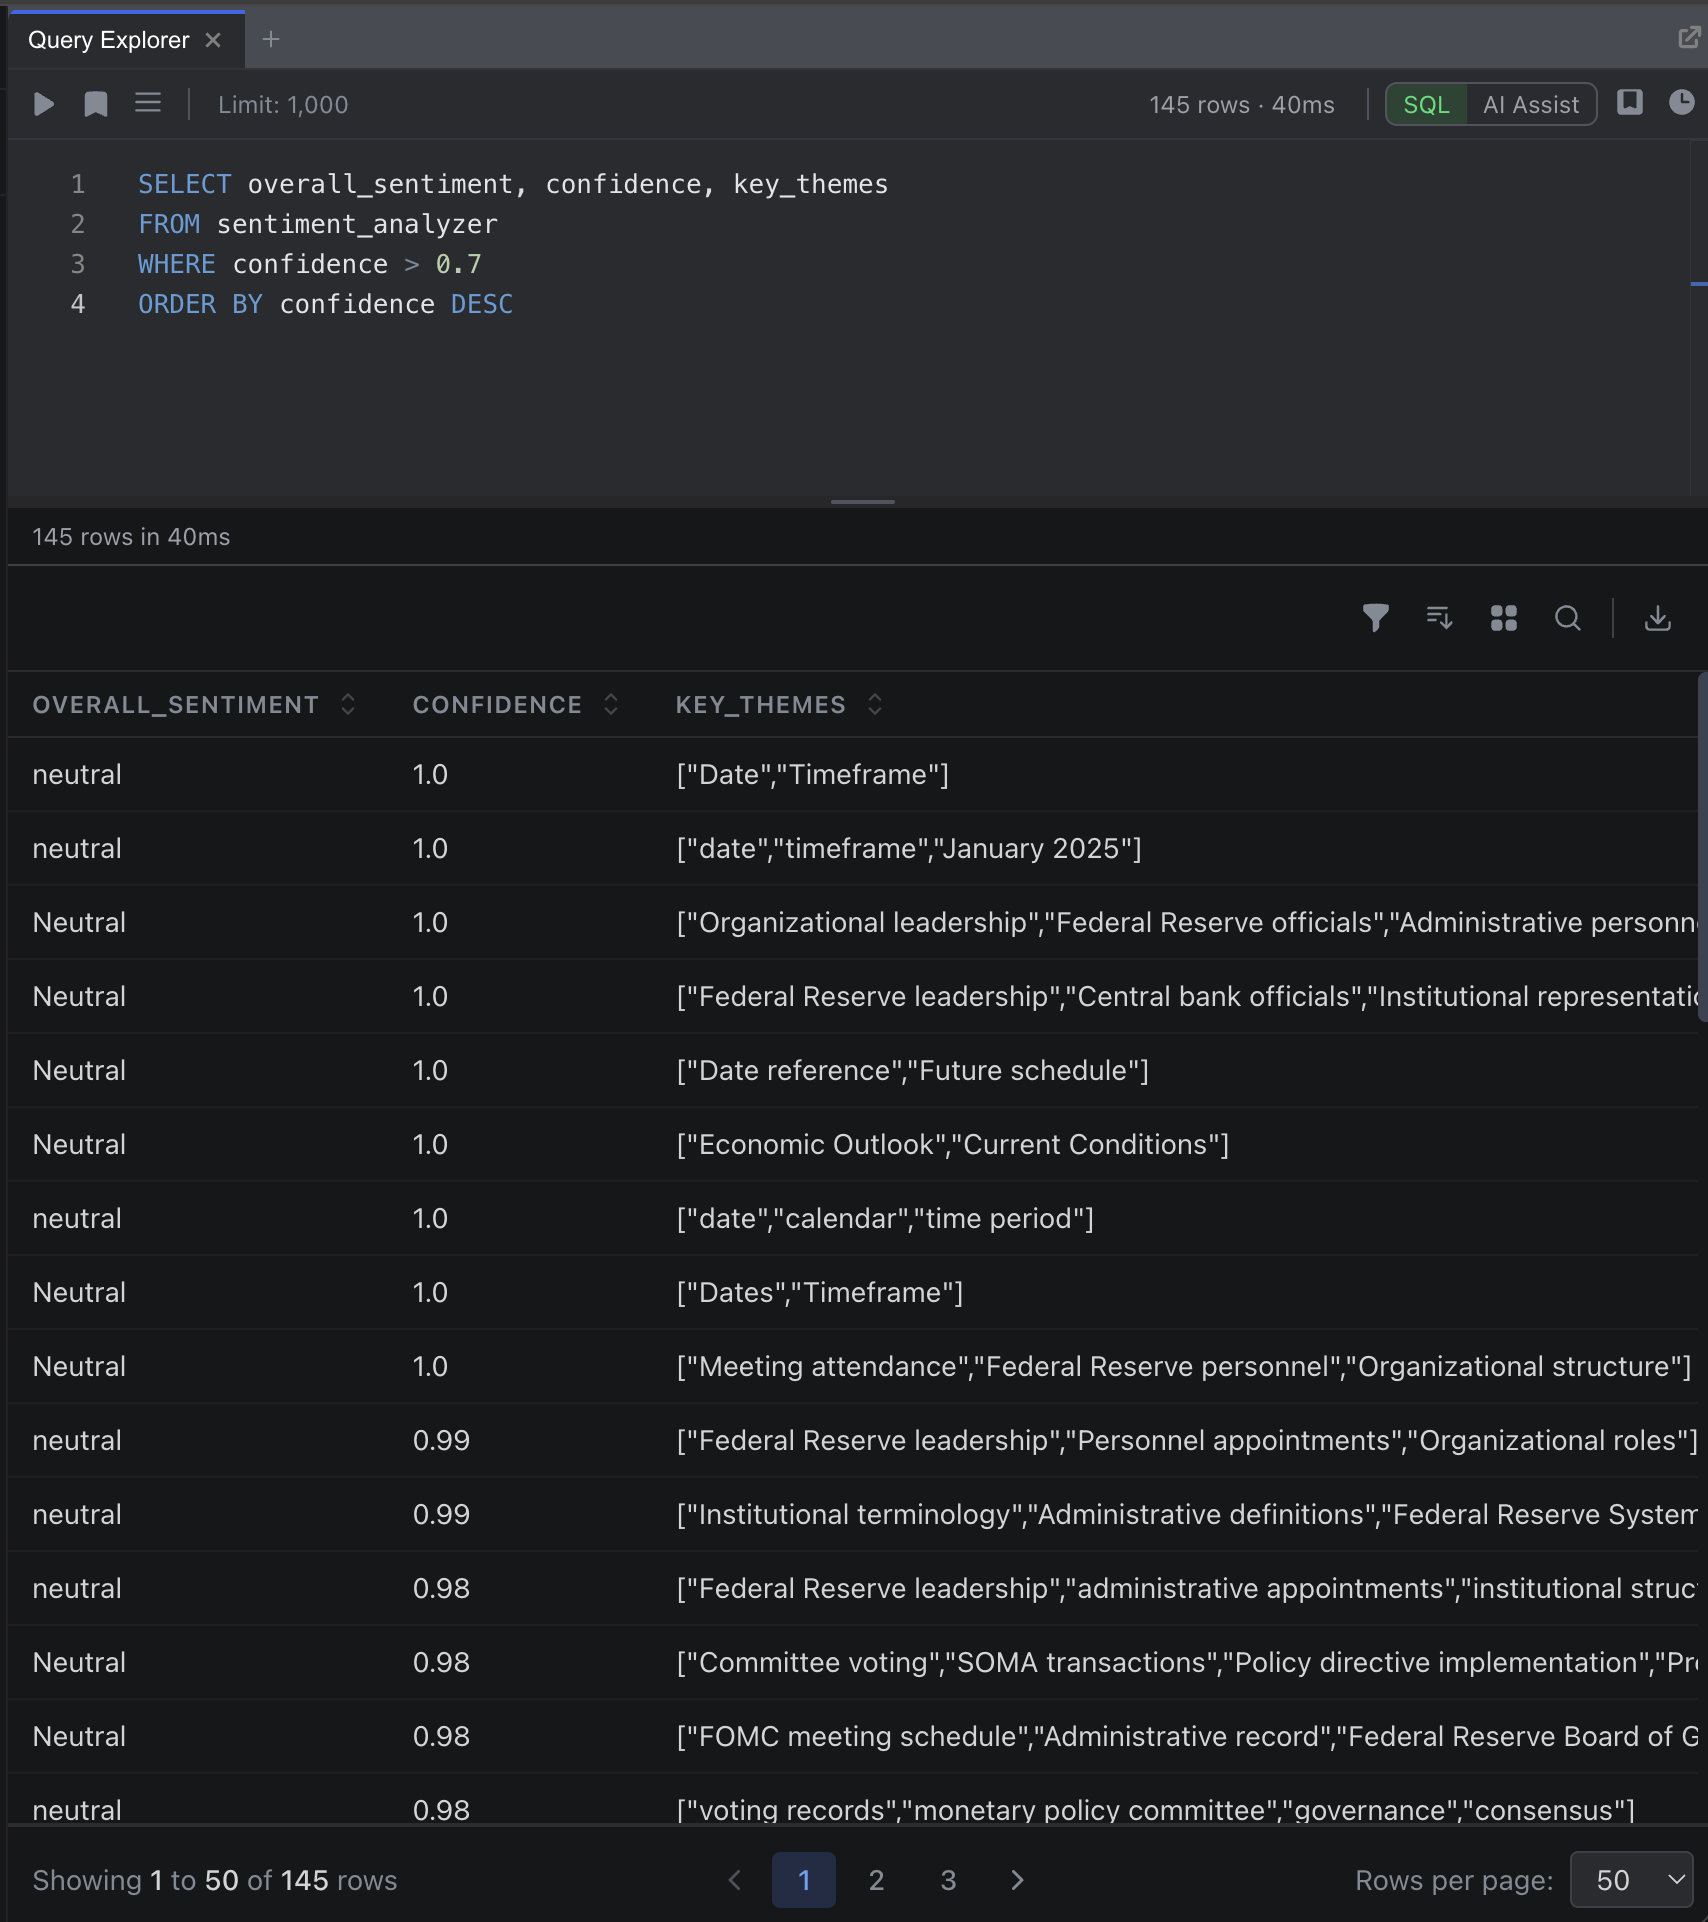
Open the Query Explorer from the sidebar. The operator name becomes a SQL table:
SELECT document_name, overall_sentiment, confidence, key_themes
FROM sentiment_analysis
WHERE confidence > 0.7
ORDER BY confidence DESC
Click Execute to run the query. Results appear in a sortable, filterable table below the editor.
Next Steps
- Your First Project: Extended tutorial with more detail
- Data Sources: Document types, processing pipeline, and management
- Operators: Schema design, prompts, and scope configuration
- Workflows: Multi-operator pipelines and conditional logic